[Bitop Review] Cryptocurrency Analysis: ARB, LTC, AAVE
2025年05月21日发布
ARB

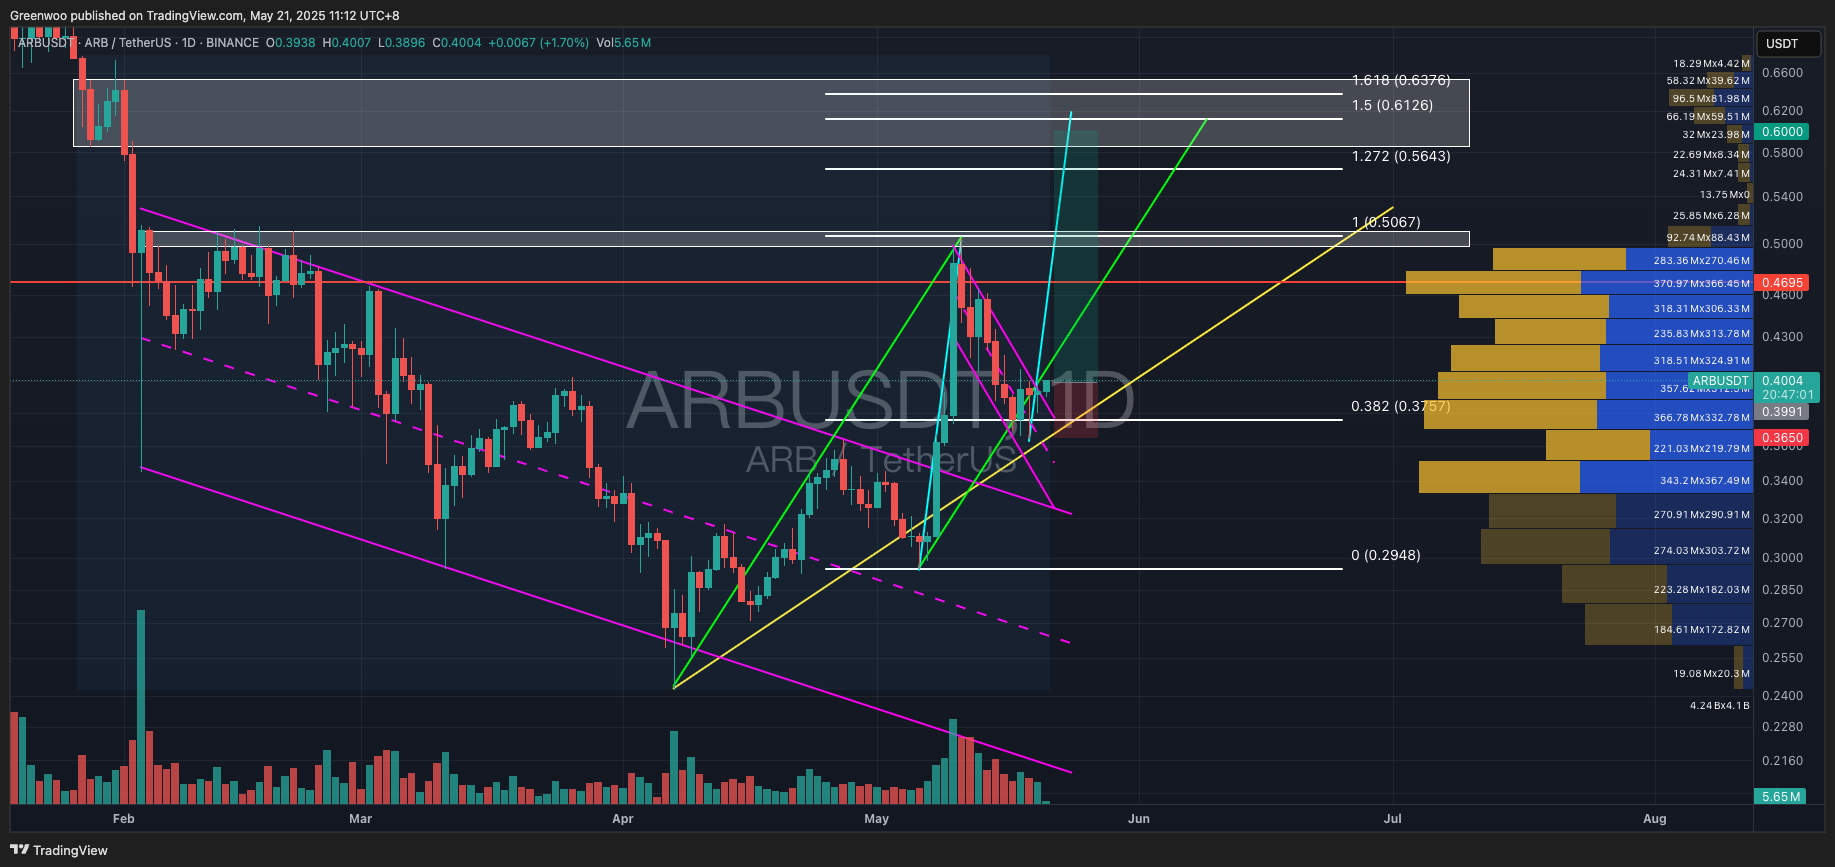
ARB recently broke out of a descending channel (purple parallel channel) and encountered resistance near $0.5, pulling back to find support at $0.365, which aligns with the 0.382 Fibonacci level. The price is gradually forming an ascending trend (yellow line).
At the time of writing, it is trading at approximately $0.4, having broken out of a flag pattern (small purple channel) by about 2.5%. This level represents a relatively good entry point, and investors may consider establishing a long position. Take-profit targets can be set based on the blue and green lines, both of which are around $0.6—a level that also corresponds to previous resistance. The stop-loss can be placed just below the prior low of $0.365.
Reference Points:
Direction: Long
Entry: $0.365 - $0.4 (market price)
Take Profit: $0.5 / $0.55 / $0.6
Stop Loss: $0.363
LTC

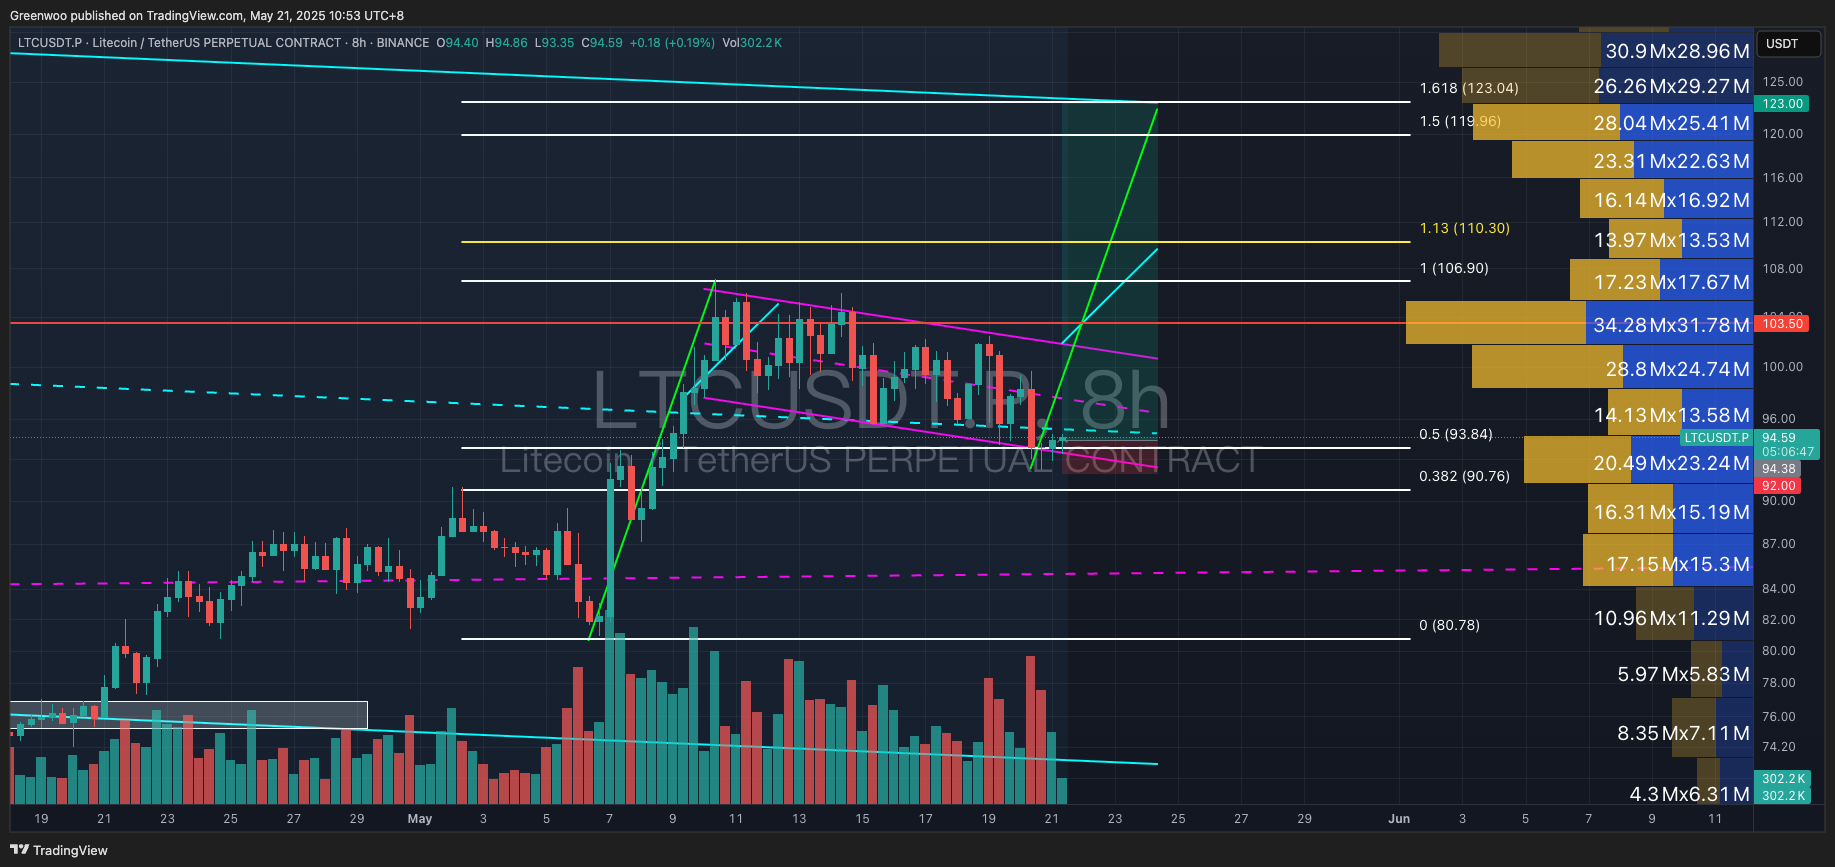
LTC has shown strong performance after bottoming out and rebounding, with the price recently forming a flag pattern, suggesting a potential continuation of the prior uptrend.
At the time of writing, it is trading around $94, which also marks the bottom of the flag pattern, making it an attractive entry point. Investors can establish a long position here, with take-profit targets based on pattern analysis (blue and green lines) set at approximately $110 and $120. The stop-loss can be placed below the previous low of $92.2.
Reference Points:
Direction: Long
Entry: $94.5 (market price)
Take Profit: $110 / $123
Stop Loss: $92
AAVE

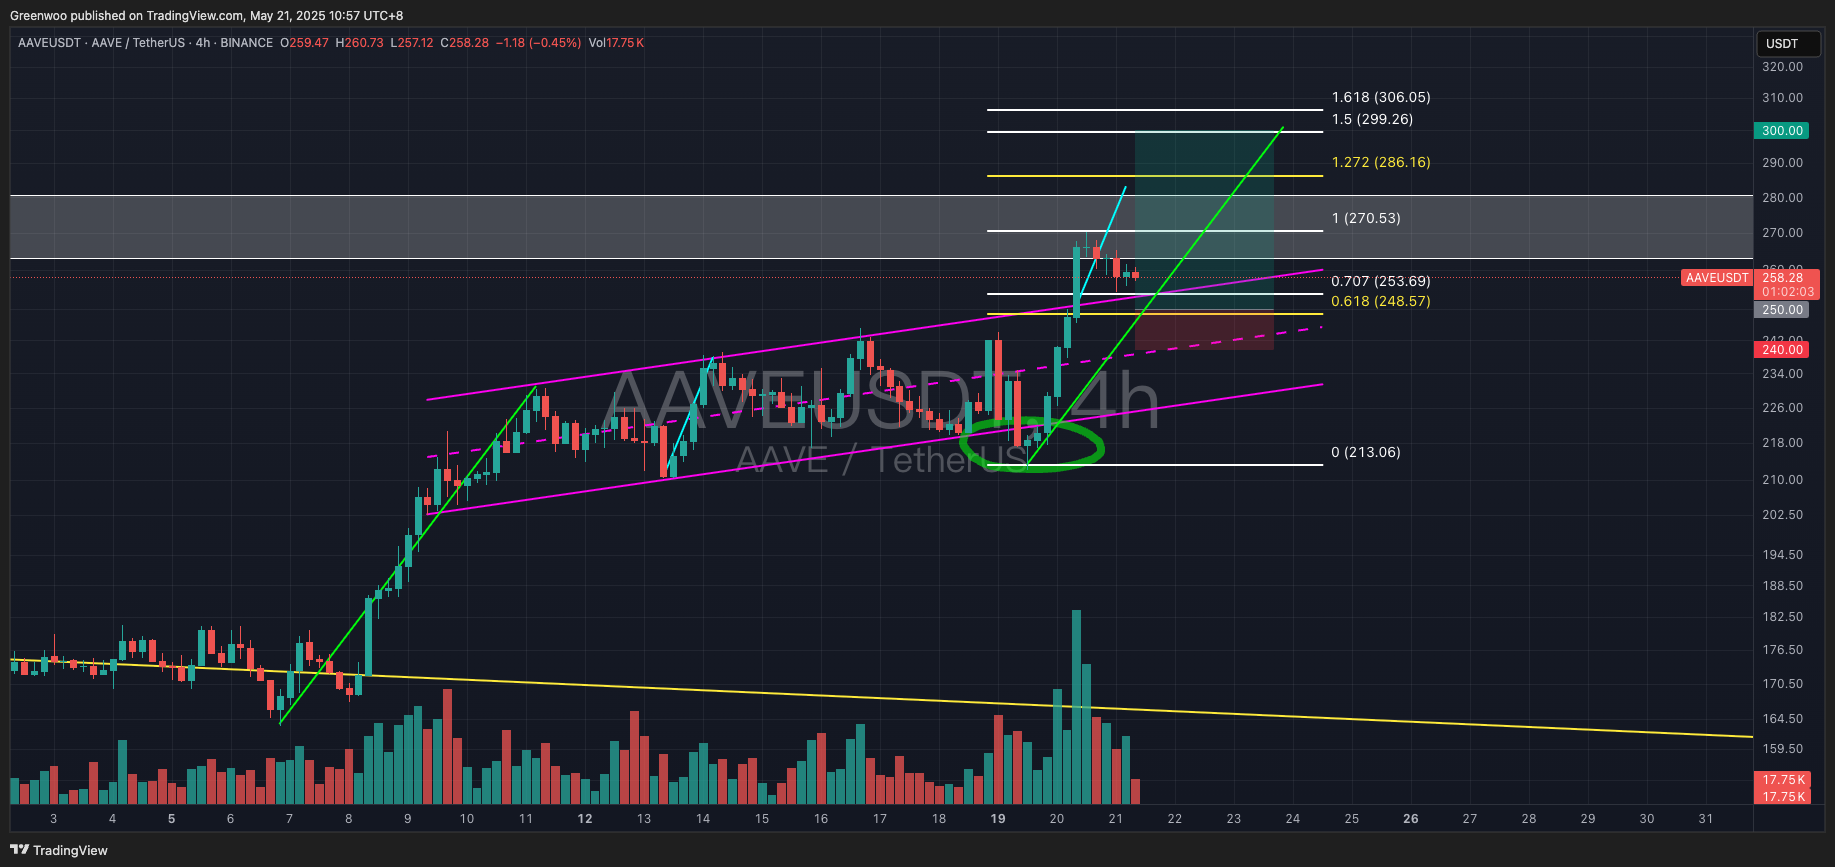
AAVE previously broke below a flag pattern but quickly recovered (highlighted by a green circle), forming a bear trap (false breakout). This indicates strong bullish momentum, making it suitable for a long position.
After breaking out of the flag pattern, it faced resistance at $270 and pulled back, with an expected test of support at $250. This level aligns with the top of the flag pattern and falls between the 0.618 and 0.707 Fibonacci levels. Investors can opt to enter at the current market price or wait for a better entry point to establish a long position.
Take-profit targets, based on pattern analysis (blue and green lines), can be set at approximately $280 and $300 for partial profit-taking, with a stop-loss placed below $240 (0.5 Fibonacci level).
Reference Points:
Direction: Long
Entry: $250
Take Profit: $280 / $300
Stop Loss: $240
Disclaimer: None of the information contained here constitutes an offer (or solicitation of an offer) to buy or sell any currency, product or financial instrument, to make any investment, or to participate in any particular trading strategy.