[Bitop Review] Technical Analysis: BTC, ETH, SOL
2025年05月06日发布
BTC

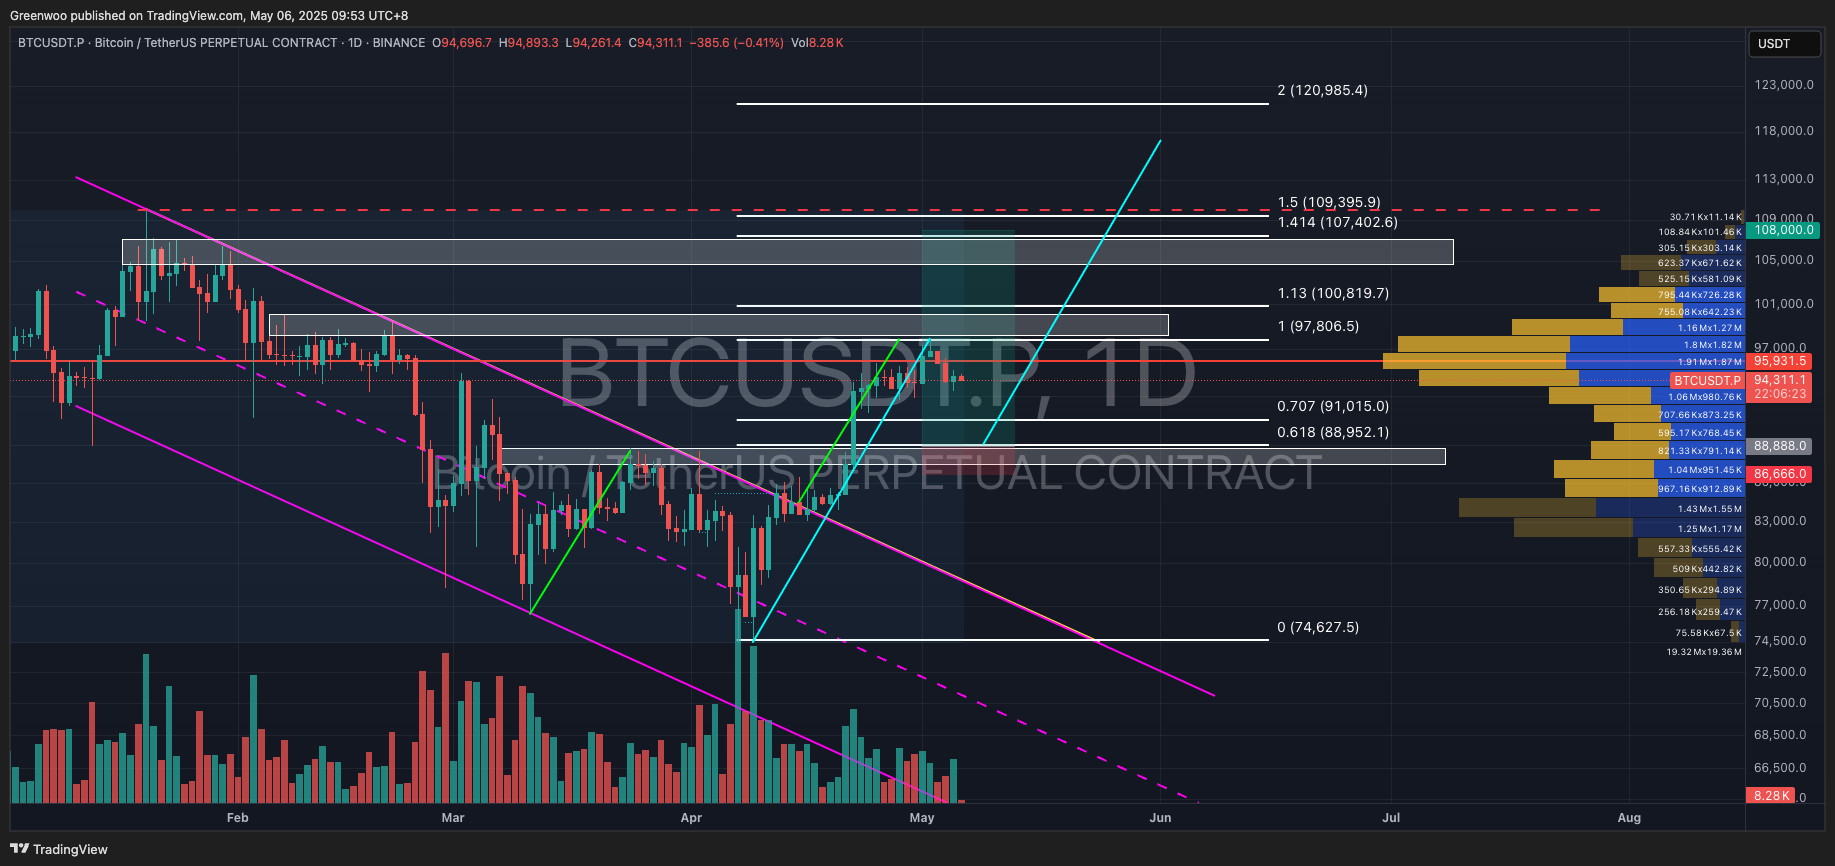
BTC has been gradually declining since hitting a resistance zone on May 2, with expected support around $88,950. This level aligns with both a support zone and the Fibonacci 0.618 retracement.
Based on pattern analysis (blue line), the target price is approximately $117,000. However, investors are advised to take partial profits at resistance levels for safety.
Key levels:
Direction: Long
Entry: $88,888 - $89,000
Take Profit: $100,800 / $107,000 / $117,000
Stop Loss: $86,666
ETH

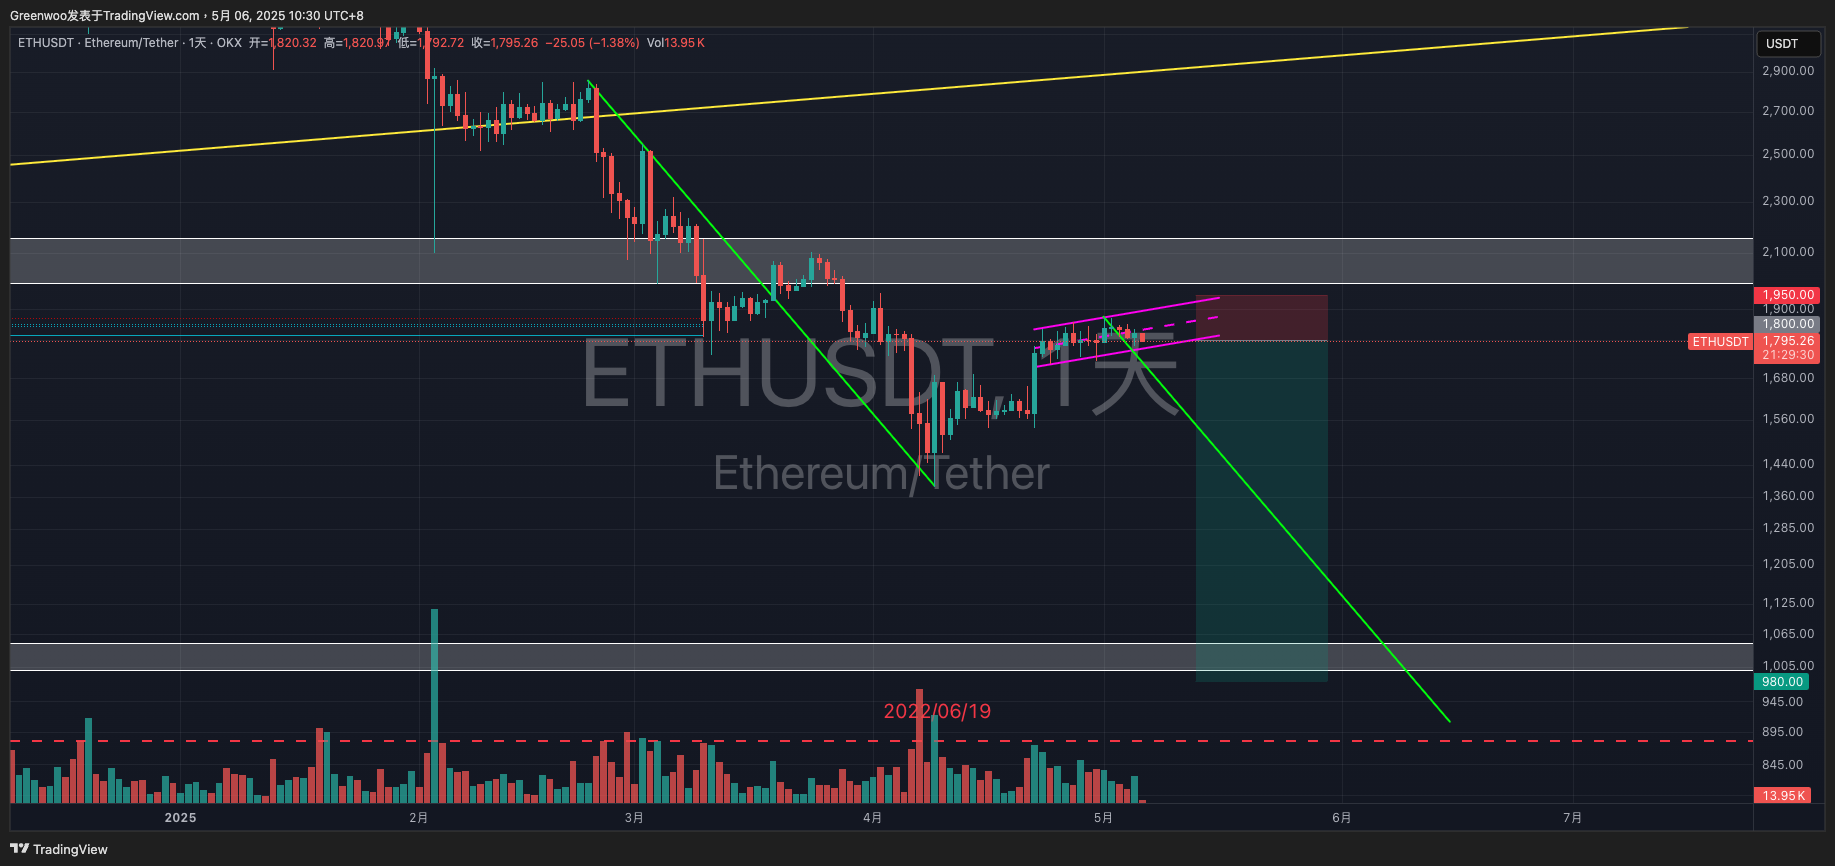
ETH has been consolidating between $1,720 and $1,870, forming a potential bullish flag pattern. However, the prior downtrend has not fully subsided, and low trading volume suggests insufficient momentum for an upward move.
Thus, the price is more likely to test lower levels, potentially finding strong support around $1,000. Maintaining last week’s view, continue shorting ETH.
Key levels:
Direction: Short
Entry: $1,800 - $1,870
Take Profit: $1,380 / $1,080 / $910
Stop Loss: $1,960
SOL

SOL saw strong buying at $140.25 last week, leading to a rally, but it failed to break the previous high of $157.2, peaking at $153.88.
Similar to BTC, the price is now in a slow decline and may find support between $133 and $138, corresponding to the Fibonacci 0.618-0.707 levels.
Using pattern analysis (blue line), the target price from this level aligns closely with the measured target of a prior wedge pattern, making it a likely starting point for a rally supported by multiple technical factors.
Key levels:
Direction: Long
Entry: $133 - $138 (Fib 0.618-0.707)
Take Profit: $177 / $218
Stop Loss: $132 / $123
Disclaimer: None of the information contained here constitutes an offer (or solicitation of an offer) to buy or sell any currency, product or financial instrument, to make any investment, or to participate in any particular trading strategy.